
Every bettor eventually asks the same question: can I actually beat the bookmakers long-term? The short answer is yes - but only if you consistently bet at prices above true probability. That requires knowing what true probability looks like before the book's margin is baked in. A sports betting model is the systematic attempt to figure that out.
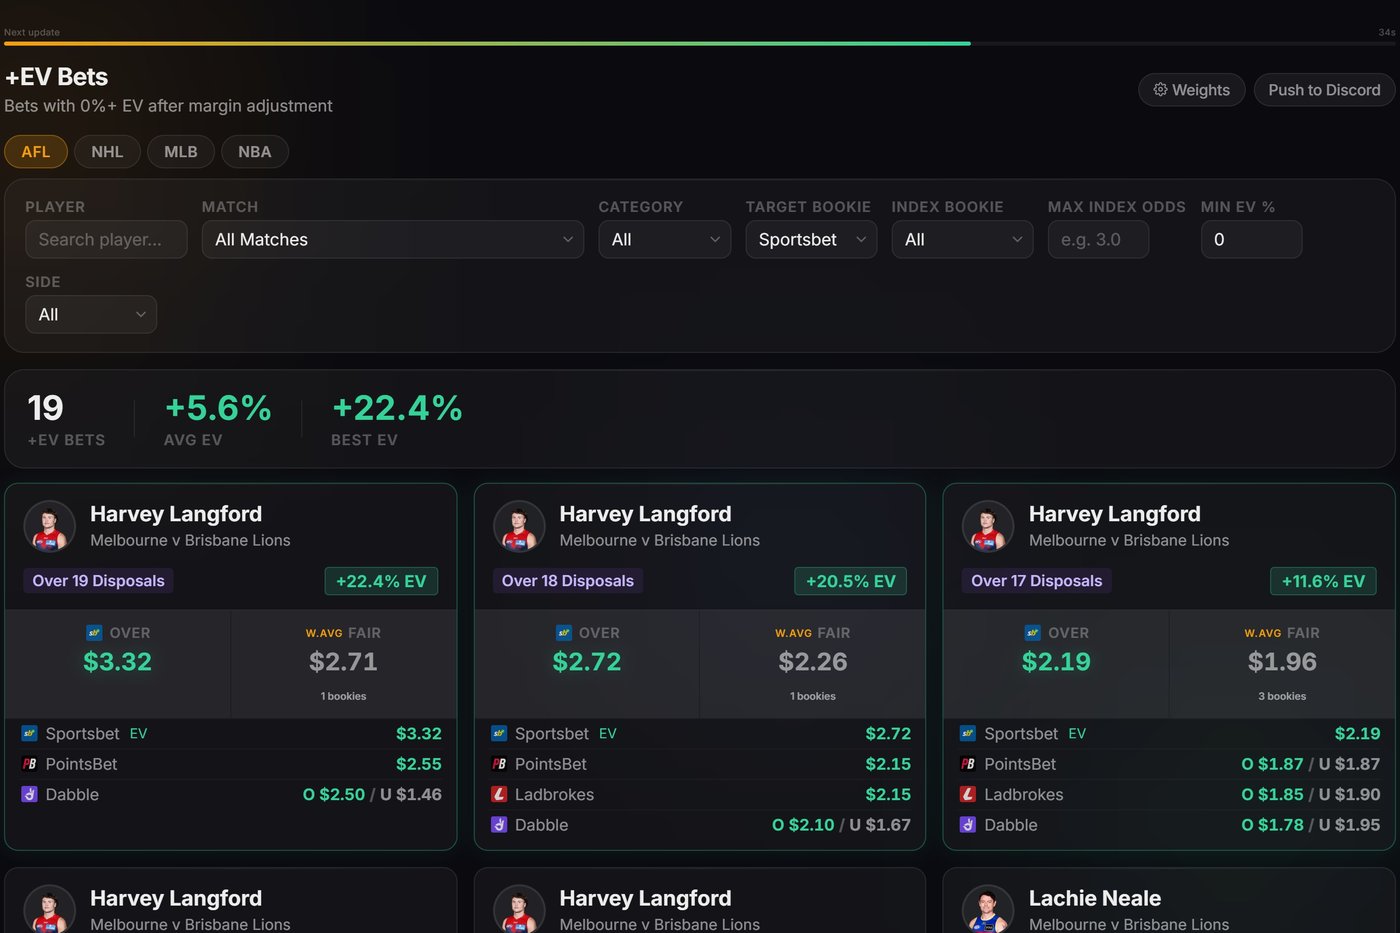
This guide walks you through how a model actually works, the data you need, the maths behind converting numbers to odds, and the critical step most guides skip - testing whether your model has genuine edge before you risk a dollar. We also cover the reality that most profitable retail bettors in 2026 never build a model at all. They use DegenToPro's market comparison and EV finder to let sharp-market pricing do the heavy lifting.
The goal of a sports betting model
A sports betting model has one job: estimate the true probability of an outcome better than the market already has. That sounds simple. It is not.
Professional bookmakers employ entire teams of quantitative analysts. Sharp bettors and syndicates hammer markets the moment lines open, pushing prices toward efficient levels within minutes. By the time a casual bettor logs on, the market odds on a major event are often a better reflection of true probability than anything an amateur model will produce.
That does not mean model-building is pointless. It means you need to understand what you are competing against. A model that estimates, say, a 52% chance of a home win when the sharp market implies 48% has found a genuine edge. A model that just replicates public consensus has found nothing.
The key insight: you are not trying to predict who wins - you are trying to assign probabilities more accurately than the price on offer. Even a "wrong" prediction can be a profitable bet if you were offered the right price.
Data collection
The quality of your model is capped by the quality of your data. Here is what actually moves outcomes in major sports and therefore what you need to collect:
Match results and historical scores
This is the baseline. You need a clean, timestamped record of every game across the competition you are modelling - who played, the score at full time, and the venue. Free sources include football-data.co.uk for European football, ESPN APIs, and various sport-specific stat aggregators. For Australian markets (AFL, NRL, A-League), websites like footywire and Champion Data (paid) are the gold standard.
Team and player performance statistics
Raw scorelines are a noisy proxy for team quality. Expected goals (xG) in football, expected points in AFL, yards per play in gridiron - these metrics strip out luck and give a cleaner read on who actually performed. Collect these at both team and individual player level where available.
Injury and availability data
A team missing its top goal scorer or first-choice goalkeeper is a fundamentally different entity from the one that played last week. Injury lists, suspension data, and teamsheet information all need to feed into your model before a game. Late scratchings - especially relevant in horse racing and AFL - can swing true probability by several percentage points.
Situational and contextual factors
Home advantage, travel distance, days of rest, weather (particularly for outdoor sports like cricket and gridiron), altitude, and even referee or umpire tendencies all contribute to outcome probability. Most amateur models ignore these. The ones that price them accurately find edge.
Line movement and market data
Ironically, one of the most useful data inputs for a betting model is the market itself. Sharp opening lines at Pinnacle or Betfair are aggregated signals from sophisticated bettors. Tracking how a line moves from open to close - and understanding whether that movement reflects sharp or public money - is a skill in itself.
Building your predictions
Once you have data, you need a method to turn it into probability estimates. Three approaches dominate amateur and semi-professional model building.
Rating systems (Elo and Poisson)
Elo ratings - originally designed for chess - assign a numerical strength value to each team. After every match, points transfer from the loser to the winner, with the size of the transfer adjusted by the expected outcome. A dominant win against a top-ranked opponent earns more Elo points than a narrow win against a lowly team. Elo is simple, transparent, and surprisingly effective for sports with consistent head-to-head formats.
Poisson modelling is common for low-scoring sports like football (soccer) and ice hockey. You model the expected number of goals each team will score - based on their attack strength and the opponent's defensive weakness - then use the Poisson distribution to convert that into probabilities for each scoreline. Summing across scorelines gives win, draw, and loss probabilities.
Regression analysis
Regression lets you identify which factors actually predict outcomes and by how much. A basic logistic regression might take inputs like home Elo rating, away Elo rating, days since last game, and home advantage factor, then output a win probability. The model learns the weights for each variable from historical data. The risk: with enough variables, you will fit historical noise rather than genuine signal - see the backtesting section below.
Machine learning
Gradient-boosted trees (XGBoost, LightGBM) and neural networks can capture non-linear relationships that regression misses. A neural network might learn that home advantage matters far more in certain weather conditions, or that a team's xG in the first 30 minutes is a stronger predictor than full-game xG. ML models require substantially more data to train reliably and are significantly harder to interpret - but in the right hands they outperform simpler approaches.
| Step | Tool / method | Output |
|---|---|---|
| 1. Data collection | APIs, scrapers, paid data providers | Clean historical dataset |
| 2. Feature engineering | Python / R (pandas, tidyverse) | Model-ready input variables |
| 3. Model selection | Elo, Poisson, logistic regression, XGBoost | Probability estimates per outcome |
| 4. Calibration | Platt scaling, isotonic regression | Probabilities that match real-world frequency |
| 5. Convert to fair odds | 1 ÷ probability | Your model's fair price |
| 6. Market comparison | DegenToPro EV finder / manual comparison | EV % per bet opportunity |
| 7. Backtesting | Walk-forward validation on held-out data | Historical P&L, CLV performance |
| 8. Live tracking | DegenToPro bet tracker + CLV dashboard | Verified edge over closing line |
Converting model probabilities to fair odds
Once your model spits out a probability - say, 55% chance of a home win - the conversion to fair odds is straightforward:
Fair odds = 1 ÷ probability
A 55% probability implies fair odds of 1 ÷ 0.55 = 1.818 (decimal). That is the price at which the bet has zero expected value. Any offered price above 1.818 is positive EV from your model's perspective. Any price below it is negative EV.
The tricky part is calibration - making sure your probabilities actually match real-world frequencies. If your model says "55% chance" and those outcomes happen 55% of the time historically, your model is well-calibrated. If they only happen 45% of the time, your model is systematically over-confident and you will lose money betting those prices.
Calibration plots and Brier scores are the standard tools for checking this. In Python, sklearn.calibration.calibration_curve will show you at a glance whether your model's probability outputs line up with historical frequencies. Do not skip this step. A model that produces impressive-looking probabilities but is poorly calibrated is a money-losing machine.
Comparing your model to the market to find EV
With a calibrated model and fair odds in hand, the process of finding expected value bets becomes mechanical:
- Your model says the true fair price on Team A to win is 2.10.
- You scan bookmakers and find TopSport is offering 2.30.
- EV = (probability × decimal odds) − 1 = (1 ÷ 2.10 × 2.30) − 1 = +9.5%.
- That is a +9.5% EV bet - bet it.
The challenge is doing this at scale across hundreds of markets before lines tighten. Sharp books move quickly. Soft books move more slowly. The window between a sharp book setting a price and a soft book catching up is where most retail +EV bettors operate.
This is precisely why most serious bettors treat market comparison software as essential infrastructure rather than a luxury. Scanning 100+ bookmakers manually across multiple sports in real time is not feasible. Automated tools are.
Backtesting and avoiding overfitting
Backtesting is where most amateur models collapse. The temptation is to tune your model on all available historical data, see a beautiful P&L curve, and conclude you have a winning system. In reality, you have almost certainly overfit to historical noise.
Walk-forward validation
The correct approach is walk-forward testing. Train your model on data up to a certain date - say, everything before 2024. Then test it on 2024 and 2025 data without touching the model parameters. Only performance on this held-out period tells you anything meaningful about future edge.
Sample size requirements
Statistical significance in betting requires more samples than most people expect. A 200-bet sample with a 5% ROI has wide confidence intervals - you cannot distinguish genuine edge from variance. As a rough rule of thumb, you need at least 500 - 1,000 bets at similar odds before the results become statistically meaningful.
Closing line value as a proxy
Rather than waiting for thousands of bets to settle, professional bettors use closing line value (CLV) as a near-real-time indicator of model quality. If you consistently bet at prices that are better than the closing line - the final price just before a match - that is strong evidence of genuine edge, regardless of short-term results. DegenToPro tracks verified CLV automatically on every recorded bet.
Red flags that indicate overfitting
- Model performs brilliantly on training data but poorly on held-out data.
- Model uses more than a handful of input features without regularisation.
- Optimal model parameters changed dramatically when you updated the dataset.
- You "improved" the model by adding features specifically because they helped explain past results.
Bankroll management and staking
The best model in the world will not save you if your staking is reckless. Two approaches dominate serious sports bettors.
Flat staking
Bet the same unit size on every qualifying bet regardless of confidence level or EV magnitude. This is simple, transparent, and prevents you from doubling down on high-confidence picks that turn out to be wrong. Many professional bettors use flat staking at 1 - 2% of bankroll per bet. It is boring. It works.
Kelly criterion
The Kelly criterion is the mathematically optimal staking system for a bettor with an accurate edge estimate. The formula is:
Kelly fraction = (bp − q) ÷ b
Where b is the decimal odds minus 1, p is your estimated probability of winning, and q is 1 − p. If your model says a bet has 8% EV at odds of 2.00, Kelly says stake 8% of your bankroll. Full Kelly is extremely aggressive - most bettors use quarter or half Kelly to reduce variance while maintaining most of the growth rate advantage.
The critical caveat: Kelly assumes your probability estimates are accurate. An overconfident model - one that thinks it has 10% edge when it actually has 2% - will recommend massively over-sized stakes and eventually ruin your bankroll. Get calibration right before applying Kelly.
The shortcut: market-derived fair odds with DegenToPro
Here is something the model-building guides rarely tell you: most consistently profitable retail bettors in Australia do not build their own predictive model.
They do not need to.
Sharp markets - particularly Pinnacle and Betfair - aggregate the predictions of hundreds of sophisticated participants. The resulting closing line is often more accurate than any individual model a retail bettor could build, especially for mainstream markets. Instead of trying to out-predict the market, the smart play is to use the sharp market price as your fair odds estimate, then hunt for soft bookmakers offering better prices.
That is exactly what DegenToPro is built to do.
- Compares prices across 100+ Australian and international bookmakers in real time.
- Derives fair odds from sharp-market consensus - no model required.
- +EV finder highlights every bet where a soft book is offering above fair price.
- Arbitrage finder surfaces two-way opportunities across books.
- Bet tracker with verified CLV - log your bets and see your closing line performance proven over time.
- Covers sport and racing markets, with live community P&L visible on the dashboard.
The workflow becomes: open DegenToPro, see which markets have positive EV right now, bet the ones that clear your threshold, log them, check CLV. No Python, no databases, no weeks of data wrangling. For bettors who want an edge without a PhD in statistics, this is the realistic path.
Skip the model. Start finding +EV bets today.
DegenToPro compares 100+ bookmakers, calculates fair odds from sharp markets, and flags every +EV opportunity - all in one dashboard. Join 6,000+ members already using it.
Start Free →That said, model-building is not pointless. For bettors with a genuine information edge - access to sharp injury data before it hits the public, specialisation in a niche competition with thin sharp-market coverage, or proprietary player tracking data - a custom model can generate real alpha. The point is that building a model is a means to an end (finding bets priced better than true probability), not an end in itself. If a tool already does that reliably, the model is redundant.
Experienced bettors often combine both approaches. They use market-derived fair odds as a sanity check against their own model estimates. When the two agree there is EV, confidence is high. When they disagree, it is a prompt to dig into why - whether the model is picking up something the market has missed, or whether the model has a bug.
The bottom line
A winning sports betting model does one thing: it estimates the true probability of an outcome more accurately than the price on offer. Getting there requires clean data, a sensible modelling approach, rigorous calibration, honest backtesting on held-out data, and disciplined staking. Each step is genuinely difficult and time-consuming to do well.
Most retail bettors are better served by treating the sharp market as their model. Pinnacle and Betfair closing lines outperform most amateur predictions on mainstream events. The skill worth developing is not predicting outcomes but identifying when soft bookmakers are lagging behind sharp pricing - and having the infrastructure to catch those windows before they close.
Whether you build your own model or use market-derived fair odds, the underlying logic is the same: find bets where price exceeds probability, stake appropriately, track CLV to verify edge, and repeat. DegenToPro is built around that exact workflow - and for most Australian bettors, it removes the need to build anything from scratch.
World Cup Offer - 20% off all plans right now
Get access to DegenToPro's full EV finder, arb screener, 100+ bookmaker comparison, and verified CLV tracker. Start on the free tier - no card needed - and upgrade when you are ready.
View Pricing →