
Here is a story every serious Australian punter knows. You spend hours finding a genuine edge, back a selection at a price that is clearly better than fair value, and watch it lose. You find another edge the next day. It loses too. Three weeks later you are down on the month despite doing everything right. You start wondering if your whole approach is wrong.
It is not. What you are experiencing is variance in sports betting - the natural, unavoidable randomness that sits on top of every edge you find. Even the sharpest bettors in the world lose money in any given month. Understanding variance is not optional if you want to survive long enough to let your edge pay out.
This guide explains what variance is, how to measure it, what kind of swings to expect at your edge and stake level, why DegenToPro tracks closing line value as a more reliable short-term signal than raw profit, and how to stay disciplined through the inevitable bad patches.
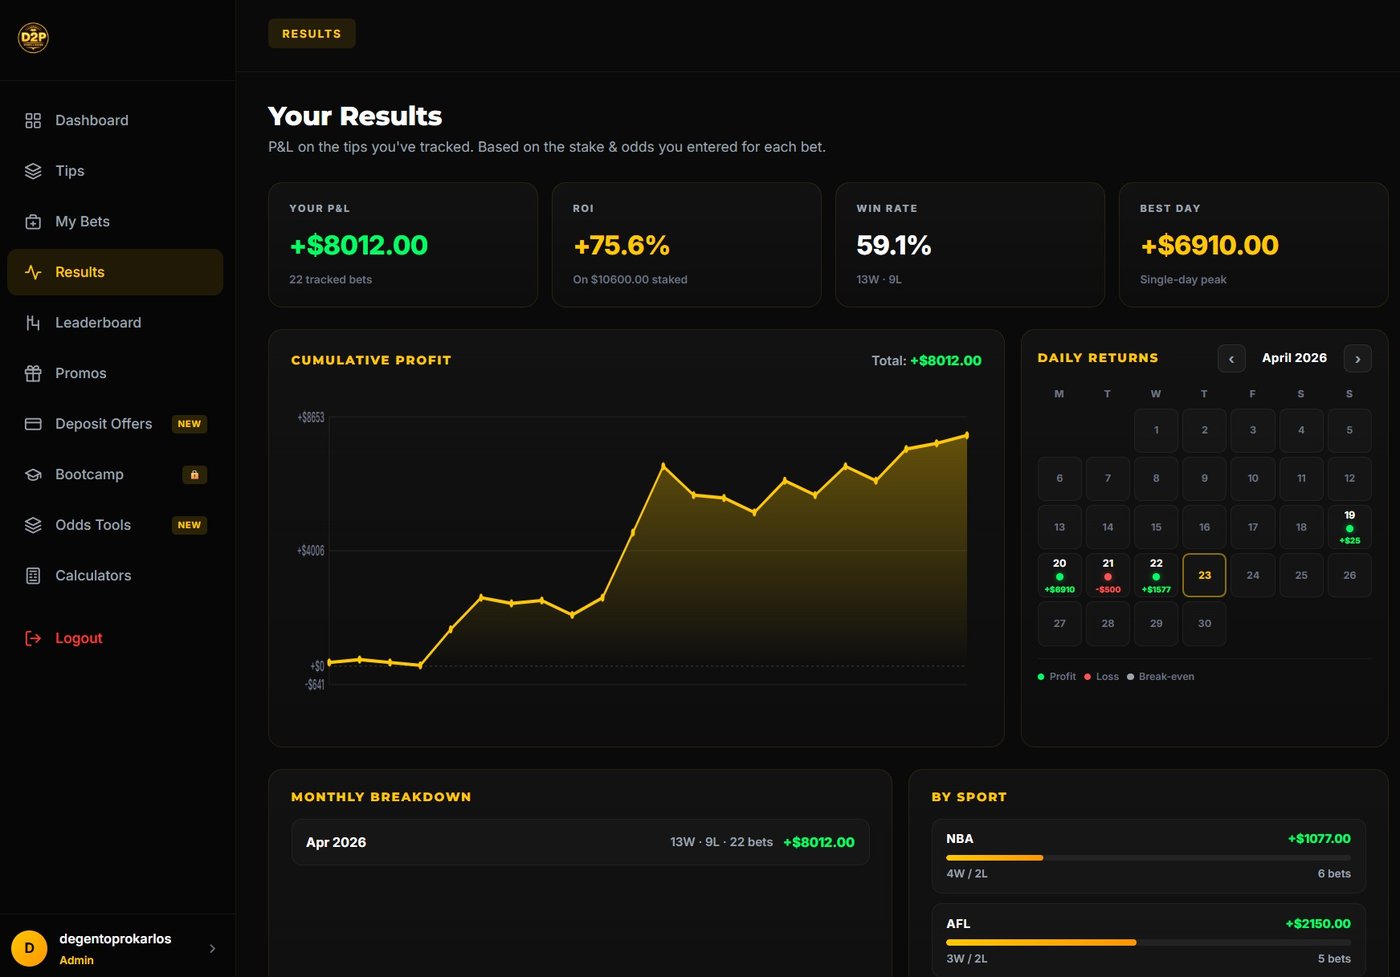
What is variance in sports betting?
Variance is the statistical measure of how much actual outcomes deviate from expected outcomes over a given sample. In betting terms, it is the gap between what your edge predicts you should win and what you actually win in any particular stretch of bets.
Consider a simple example. You find a bet where the true probability of winning is 52% and the bookmaker is offering odds that imply only 50% probability. You have a genuine 2% edge on this bet. If you place it 100 times, your expected profit is positive. But you will not win exactly 52 out of 100 times. You might win 44 times. You might win 61 times. The expected value is fixed; the actual result is not.
This gap between expected and actual is variance. And in sports betting, where individual events are binary (win or lose), variance is enormous relative to the typical edge on offer. A 3% edge sounds healthy but it is tiny compared to the swings that 50/50 binary outcomes produce over hundreds of bets.
Variance is not the same as losing. Variance is randomness. Sometimes it runs in your favour. Often it does not. Over a large enough sample, your actual results converge toward your expected value - but "large enough" means thousands of bets, not dozens or even hundreds.
Why +EV bettors still have losing weeks and months
The most common misconception in sports betting is that having an edge means winning consistently. It does not. Having an edge means that over a very large sample, your cumulative profit should be positive. In any short window, the variance can swamp the edge entirely.
Think about what a 3% edge actually looks like in practice. On a $100 flat-stake bet at even money, your expected profit per bet is $3. After 50 bets, your expected profit is $150. But your actual results after 50 bets could easily range from a loss of $400 to a profit of $700 - all within one standard deviation of the expected outcome. A losing month is not evidence your edge is gone. It is statistical noise.
The mathematics become even more challenging at longer odds. If you are betting primarily on selections priced around $3.00 to $5.00, the variance per bet is vastly higher than if you are betting on even-money markets. A 20% edge on a $4.00 shot is a genuinely excellent find, but you can lose 15 of those in a row through pure variance and still have a positive expected return on the strategy. Many punters abandon a winning approach long before the edge has had a chance to express itself.
Losing weeks and months are not a sign of failure for a +EV bettor. They are an inevitable feature of the game. The professional response is to track the right metrics - not just profit and loss - so you have evidence about whether your process is sound regardless of what results are doing.
Standard deviation and sample size
Standard deviation is the tool that lets you put numbers on variance. In sports betting, the standard deviation of a single bet at decimal odds d with stake s and win probability p is:
SD per bet = s × sqrt(p × (1 - p) × d²)For a flat-stake bettor placing bets at even money ($2.00 odds) with a 52% win rate on $100 stakes, the standard deviation per bet is approximately $100. After n bets, the standard deviation of your total result is approximately $100 × sqrt(n). After 100 bets, your results could reasonably swing about $1,000 either side of expected value. After 400 bets, about $2,000 either side.
The key insight is that standard deviation scales with the square root of the number of bets, while expected profit scales linearly. This means that as your sample grows, your expected profit grows faster than the typical swing. Eventually - usually around 1,000 or more bets at typical edges - the signal (your edge) starts to dominate the noise (variance). Before that point, anything can happen.
Sample size requirements depend heavily on your edge and the odds you are betting at. Rough thresholds for a meaningful profit signal:
- A 2% edge at even money: approximately 1,500 to 2,000 bets before profit is statistically meaningful
- A 4% edge at even money: approximately 800 to 1,000 bets
- A 6% edge at even money: approximately 400 to 500 bets
- Any edge at $3.00 or higher odds: multiply the above by two to four times
Most recreational bettors never accumulate anything close to these sample sizes before changing their strategy. They see a losing month, panic, and start chasing, changing systems, or abandoning a perfectly sound approach. Understanding the sample size required for meaningful results is one of the most important pieces of knowledge a punter can have.
Downswings and risk of ruin
A downswing is a losing run that occurs through variance, not through any failure of your process. Even with a genuine 4% edge on even-money bets, runs of 10 consecutive losses are routine. Runs of 15 or 20 consecutive losses occur with unsettling regularity. At longer odds, strings of 20 or 30 consecutive losers are completely within normal statistical parameters.
The danger is not the downswing itself. The danger is what happens to your bankroll and your psychology if you are not prepared for it.
Risk of ruin is the probability that a bad run of variance depletes your bankroll to zero before your edge pays out. It is determined by three factors: the size of your edge, the variance of your bets (linked to the odds you are backing), and your staking as a percentage of your total bank. Even a genuine +EV bettor faces meaningful risk of ruin if they stake too large a proportion of their bank on each bet.
The Kelly Criterion - and its more conservative fractional variants - is designed to maximise long-term growth while keeping risk of ruin at an acceptable level. At a 4% edge on even money, full Kelly staking suggests betting around 4% of your bank per bet. Most professionals use a fraction of Kelly (typically 25% to 50% of full Kelly) to further reduce variance and risk of ruin at the cost of slightly slower growth.
The practical implications for Australian punters are straightforward. If you are flat-staking 5% or more of your bank on each bet, a routine downswing can cut your bank by 50% or more before your edge recovers. At 1% to 2% per bet, you can survive the normal downswings that variance will inevitably deliver and still be in the game when your edge expresses itself.
See the bankroll management guide for a full breakdown of staking strategies and Kelly Criterion calculations for Australian punters.
Why CLV is a better short-term signal than profit
If profit over a small sample tells you almost nothing about your process, what does? The answer is closing line value (CLV) - the difference between the price you obtained and the price the market settled on at kick-off.
CLV works as a short-term signal because it is result-independent. When you back a team at $2.10 and the market closes at $1.90, you have captured positive CLV regardless of whether the team wins or loses. The market - which by kick-off reflects the collective opinion of sharp money, professional traders, and thousands of informed bettors - moved in the direction of your selection. That tells you something real about the quality of your bet at the time of placement.
The key properties that make CLV superior to profit as a short-term diagnostic:
- It is not affected by results variance. A last-minute injury ruling, a bad refereeing decision, or a freak weather event can turn a +CLV bet into a loser. The CLV remains positive. Your process was sound; the outcome was unlucky.
- It converges faster. Detecting a genuine edge from profit data requires thousands of settled bets. A meaningful CLV signal emerges in a few hundred bets because each data point is informative regardless of the result.
- It reflects the quality of your timing and line shopping. CLV is driven by whether you found better prices than where the market ultimately settled. That is a process question, not a luck question.
- Bookmakers use it themselves. Australian and international sportsbooks restrict and limit accounts based on CLV patterns, not profit. They know that sustained positive CLV is the real signal of a sharp bettor.
A bettor with consistently positive CLV over 300 bets is demonstrating genuine edge even if their profit figure is flat or slightly negative due to variance. A bettor with flat or negative CLV over 300 bets is not demonstrating edge even if they happen to be up due to a lucky run. CLV strips away the noise that variance generates and reveals what is actually happening in your betting process.
Read the full closing line value guide for a complete breakdown of how to calculate and interpret CLV.
Simulating outcomes: what your results might look like
One of the most powerful ways to understand variance is to run simulations of what a genuine +EV bettor's results might look like over time. The mathematics are sobering for anyone who expects consistency.
Imagine a bettor with a verified 4% edge on even-money bets, staking $100 flat per bet. Their expected profit per bet is $4. After 500 bets, expected profit is $2,000. But if you simulate this scenario 10,000 times, the range of outcomes after 500 bets is enormous:
- Roughly 5% of simulations will show a loss after 500 bets despite a genuine 4% edge
- Roughly 15% will show a profit of less than $500, or less than a quarter of the expected return
- Roughly 15% will show a profit greater than $3,500, or nearly double the expected return
- The median outcome is close to expected, but the spread is huge
After 200 bets, the situation is even more stark. A genuine 4% edge bettor will be in negative territory after 200 bets roughly 20% of the time. If you are that bettor, looking at your results after 200 bets and seeing a loss, the correct statistical inference is almost certainly "variance" rather than "my edge is gone." But most punters will not wait to find out.
The simulations also illustrate how variance compounds at longer odds. A bettor with a 10% edge on $4.00 shots has a higher expected profit per bet than the 4% even-money bettor, but their results after 200 or even 500 bets are far more spread out. The peaks are higher and the troughs are deeper. Patience and bankroll management become even more critical at longer odds.
Expected swings by bet count and edge
The table below shows the typical range of profit outcomes (roughly one standard deviation either side of expected value) for a flat $100-stake bettor at different edges and bet counts. All figures assume even-money ($2.00) bets for simplicity. Longer odds will produce wider swings for the same edge percentage.
| Number of Bets | Edge 2% | Edge 4% | Edge 6% | What this means |
|---|---|---|---|---|
| 50 bets | Expected +$100, range -$600 to +$800 | Expected +$200, range -$500 to +$900 | Expected +$300, range -$400 to +$1,000 | Results essentially meaningless - pure noise |
| 100 bets | Expected +$200, range -$800 to +$1,200 | Expected +$400, range -$600 to +$1,400 | Expected +$600, range -$400 to +$1,600 | Losing is still very common even with genuine edge |
| 200 bets | Expected +$400, range -$1,000 to +$1,800 | Expected +$800, range -$600 to +$2,200 | Expected +$1,200, range -$200 to +$2,600 | Signal starts to emerge for larger edges only |
| 500 bets | Expected +$1,000, range -$1,000 to +$3,000 | Expected +$2,000, range 0 to +$4,000 | Expected +$3,000, range +$1,000 to +$5,000 | Meaningful signal for 4%+ edges; still noisy at 2% |
| 1,000 bets | Expected +$2,000, range -$1,200 to +$5,200 | Expected +$4,000, range +$800 to +$7,200 | Expected +$6,000, range +$2,800 to +$9,200 | A 4%+ edge should be clearly profitable; 2% still uncertain |
| 2,000 bets | Expected +$4,000, range +$400 to +$7,600 | Expected +$8,000, range +$4,400 to +$11,600 | Expected +$12,000, range +$8,400 to +$15,600 | All edges become statistically clear; process is validated |
The table makes the variance problem concrete. A bettor with a 2% edge who is down $300 after 100 bets has no statistical reason to believe anything is wrong. That outcome sits well within the expected range of results. Only around 2,000 bets does the signal become clear enough that profit alone can validate or invalidate a 2% edge. CLV, by contrast, gives you meaningful feedback much sooner.
Staying disciplined through variance
Knowing that variance is real and that downswings are inevitable is one thing. Staying disciplined when you are 20 units down over six weeks is another. Here are the practical principles that separate bettors who survive variance from those who blow up:
Track the right metrics from day one
Profit and loss is not your primary metric. CLV is. Set up a tracking system - ideally one that automatically pulls closing prices and grades each bet - from the first day you start. When you are in a downswing, your CLV data will tell you whether you are unlucky (positive CLV, losing results) or whether your process is broken (flat or negative CLV). That distinction is everything.
Set your staking before variance arrives
Do not decide how much to stake per bet after you have had a losing run. Decide it before you start betting, based on your bankroll, your edge estimate, and your risk tolerance. Then stick to it. Increasing stakes to "recover" losses is how a manageable downswing becomes a catastrophic one. Reducing stakes due to fear during a normal downswing is how you miss the recovery when it comes.
Define a minimum sample before reviewing strategy
Pick a number - say, 300 bets - and commit to not making fundamental changes to your strategy before you reach it. Review your CLV throughout. If your CLV is consistently positive, continue. If your CLV is clearly negative at 300 bets, that is a meaningful signal to investigate and potentially change course. But do not make major changes based on 50 or 100 bets of results data.
Separate bet quality from bet results
Every time you lose a bet, ask whether it was a good bet at the time of placing it. Did you get a better price than where the market closed? Was the bet based on a systematic edge or on gut feel? Losing a good bet is fine. Losing a bad bet is a process problem regardless of whether it would have won. Build the habit of evaluating process rather than outcomes.
Keep detailed records
The antidote to variance anxiety is data. When you have 500 bets logged with full CLV grades, stake sizes, sports, bet types, and bookmakers, you have something to analyse during a downswing rather than just feelings about whether things are going wrong. Data makes variance manageable. Betting blind makes it terrifying.
Protect your mental game
Variance affects psychology as much as bankroll. Loss aversion - the cognitive bias that makes losses feel roughly twice as painful as equivalent gains feel good - can cause perfectly rational bettors to make irrational decisions during a downswing. Knowing this is happening does not make it easy to resist, but it does make it easier to build systems that protect you from yourself. Automated bet logging, pre-committed staking, and CLV tracking are all forms of variance-proofing your decision-making.
Stop guessing - track your real edge with DegenToPro
DegenToPro automatically grades closing line value on every bet you log across 100+ bookmakers. See whether your edge is real even when variance is running against you. Free to start, no card required.
Start Free →How DegenToPro keeps you grounded when variance bites
The practical problem for most Australian punters is that calculating CLV manually is tedious enough that they simply do not do it. They track wins and losses in a spreadsheet - or, more commonly, they just check their balance - and try to infer whether their process is working from a profit figure that is dominated by variance in the short term.
DegenToPro solves this directly. Every bet you log is automatically graded for closing line value after the market settles. The platform pulls the closing price from the market, removes the margin to find the fair close, and calculates your CLV on each bet without you doing anything beyond logging the original bet. Your running CLV averages update automatically across your full bet history.
What this means in practice: you back an NRL selection on Wednesday evening at $2.20. By kick-off on Thursday, sharp money has moved the line to $1.95. DegenToPro records the close, calculates your CLV at approximately +12.8%, and adds it to your running average. When Saturday rolls around and you have had a losing week on results, you can open your dashboard, look at your CLV for the week, and see whether you were unlucky (+EV process, negative variance) or whether something is genuinely wrong with your selections.
That context is invaluable for maintaining discipline through downswings. Losing weeks feel different when your dashboard shows you that you were +CLV on 8 of your 10 bets and the market moved in your favour by an average of 5%. You know you are doing the right things. The results will come.
DegenToPro covers more than 100 Australian and international bookmakers, so your CLV grades reflect the real prices available across the books you are actually using. The community dashboard shows live aggregate profit and CLV data across all tracked members - a live signal of collective edge from a community of more than 6,000 Australian punters on Discord. You can see in real time whether the community is beating the close, which gives you a benchmark for your own performance.
Beyond CLV tracking, DegenToPro includes a +EV finder that surfaces positive expected value opportunities across sports and racing markets in real time. This matters for variance management because it helps you find bets with genuine edges rather than guessing, which means your CLV data is more likely to be positive and your variance is more likely to eventually convert into profit.
The +EV betting guide explains how expected value betting works in practice and how to use DegenToPro's EV finder to identify genuine opportunities across the Australian market.
The bottom line
Variance in sports betting is not the enemy. It is a permanent feature of the landscape that every serious punter has to understand and account for. The bettors who survive and ultimately profit are not the ones who avoid variance - nobody can do that. They are the ones who understand it deeply enough to stay disciplined when it runs against them.
The core lessons from this guide: expect losing months even with a genuine edge; do not judge your process by short-term results; understand that meaningful profit signals require hundreds to thousands of bets depending on your edge; manage your staking to survive normal downswings without risking ruin; and track CLV as your primary short-term measure of whether your process is working.
CLV is the variance-resistant signal that tells you whether you are genuinely beating the market - not what your profit and loss says happened, but what the market says about the quality of your bets at the time you placed them. Positive CLV over a meaningful sample is the clearest evidence available that your process is sound and your edge is real.
DegenToPro is built specifically to give Australian punters this kind of verified, data-driven view of their betting. The automatic CLV grading, +EV finder, 100+ bookmaker coverage, and live community profit dashboard mean you have genuine evidence about your edge rather than guesswork. When variance is hiding your profits, your CLV data shows you the truth.
World Cup Offer pricing is live now - 20% off all paid plans. Weekly access from $59.99 AUD, Monthly from $299.99 AUD, and Lifetime access at $699.99 AUD. The free tier requires no card and gives you access to the core bet tracker and CLV grading so you can start building your data set today.
Start tracking your edge today - World Cup Offer: 20% off
Join 6,000+ Australian punters using DegenToPro to track verified CLV, survive variance with discipline, and build a betting process grounded in genuine edge. Free to start, no card required.
See Plans & Start Free →